
Python Project
This was one of my first projects using python. In this project we had to import stock prices of any 5 stocks and S&P500 and conduct various calculations on them. This project is limited only up to the project goals and objectives mentioned below.
Project Goals & Objectives
The goal of this project is to import data from an online source and process the data using various python libraries. Your group will choose five distinct equities or assets in different classes. A regression analysis on each of the asset against the S&P 500 will determine if there is any correlation.
-
Collecting Data
-
Choose five distinct equities or assets (oil, gold, bonds, currency pairs, bitcoins, etc…).
-
Verify there is data available to import from Quandl, Alpha Vantage or Yahoo Finance.
-
Import daily prices (adj closing or spot) for all five assets.
-
Use 1/1/2019 as the start date and 12/31/2019 as the end date.
-
Display the first 5 rows and the total count for each asset.
-
Import daily prices for the S&P 500. Use 1/1/2019 as the start date and 12/31/2019 as the end date.
-
Display the first 5 rows and the total count of the S&P.
2. Processing Data
-
Calculate daily % change (adj closing or spot) for each of the asset and the S&P.
-
Display the first 5 rows and the total count for each data set.
-
Plot the daily % change (adj closing or spot) data using a bar graph for each asset.
-
Calculate and display the mean, standard deviation, variance, min, and max for each set of data.
3. Regression Analysis
-
Using scikit-learn, perform five linear regressions for each of the five assets against the S&P 500.
-
Y should be % change S&P 500. X should be % change for each asset.
-
For each regression, plot the samples and the linear model. Label the Y axis as S&P 500 and the X axis as each asset.
-
Calculate and display the intercept, coefficient (slope), R2, and the Mean squared error.
-
Which asset is highly correlated with the S&P 500 and which asset is the least correlated?
Step 1
Step 2
Step 3
Step 4
Step 5
Step 6
Finding data
First we shortlisted the companies we want to conduct our analysis on, which are:
-
Apple
-
Walmart
-
Tesla
-
Pfizer
-
Shell PLC
Once we shortlisted the companies, we downloaded the prices and volumes for these shares and S&P500 from yahoo finance. We also ensured that these prices were from 1/1/2019 and 12/31/2019.
Importing libraries
First we import the libraries that will help us in importing, cleaning and modifying our table.

Reading and verifying stock data

Above we have imported the csv files for each company which contains the Date, Opening price for the day, Highest price during the day, Lowest price during the day, Closing price for the day, Adjusted Closing Price for the day and the volumes traded for the day.

Once the data is imported, we check to see if the dates for the stocks are between 2019-01-02 and 2019-12-31. We can see that the minimum and maximum dates are according to our requirements.
Segmenting, Renaming and Combining data
In order to conduct our analysis we require the date and Adj.Close column from each of the stock tables and need to join all the Adj.Close columns in one table using Date as a common join.
Below, we have selected only the date and Adj.Close columns from each stock table and stored them in new variables. For example, Date and Adj.Close for apple is stored in variable a.
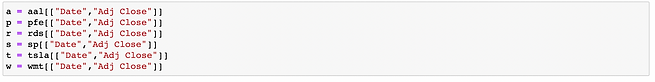
Before we combine all Adj.Close columns into one single table, we first need to rename the Adj.Close columns to the name of their stocks in order to identify which stocks Adj.Close price is when we create a single table.

Once the data is imported, we check to see if the dates for the stocks are between 2019-01-02 and 2019-12-31. We can see that the minimum and maximum dates are according to our requirements.

We now group all the new variable and assign it to variable named 'data' and then we use the date column to inner join all the Adj.Close columns together.

In order to conduct analysis, we will require new columns in the table which consists of percentage change in price for each stock. In order to obtain percentage change, we will compare the Adj.Closing price of a stock to its previous day's Adj.Closing price. As it can be seen above, the percentage change is null for the first row, this is because 2019-01-02 is the first day and there is no other day before that, thus it is unable to compare and calculate the percentage change.
We can now conduct basic analysis of this table.
Analysis
We will firstly import a few libraries which will help us in visualizing our data.

Once we import the libraries, we can now create histograms for each stock to see the percentage change in price. This will allow us to examine which stock has higher volatility.


Now we need to calculate mean, min, max, variance and standard deviation for each stock for which we have grouped percentage change column of all stocks and assigned it to a variable called 'num_cols' and then ran a loop to obtain the calculations for each stock.

We can see that Tesla (tsla) has the highest standard deviation and variance, which means Tesla stock price is highly volatile.
Linear Regression
For conducting linear regression analysis, our X will be % change in each stock and our Y will be % change in S&P500. We will be checking the correlation between different stocks and S&P500.
First we prepare our data to conduct Linear regression.


Calculating R2, mean squared error, intercept and coefficient.


THANK YOU!!
Team Members:
Dean Franco
Sabrina
Patrick
Urvaksh
Michael